Discuss anything which doesn't fall into the other categories here.
-
sandpiper
- Posts: 30
- Joined: Sun Jun 13, 2010 8:57 am
Post
by sandpiper » Sun Jun 13, 2010 9:05 am
I love the new website. Great job.
When using two ECM-1240s connected to a MUX-2 and a single EP-1, you talk about an occasional " data collision".
The downfall of using this method is that the occasional data collision may occur. This will not affect the data integrity, it would only affect the load profile slightly. Our demo site has been using a MUX-2 adaptor for nearly a year now.
I understand the "collision" and "data integrity", but what is the "load profile"? How does this affect the collection and display of the data?
-
paulb
- Posts: 122
- Joined: Fri Jun 04, 2010 11:11 am
Post
by paulb » Sun Jun 13, 2010 11:35 pm
The load profile is simply a plot of load power versus time. I have attached three examples.
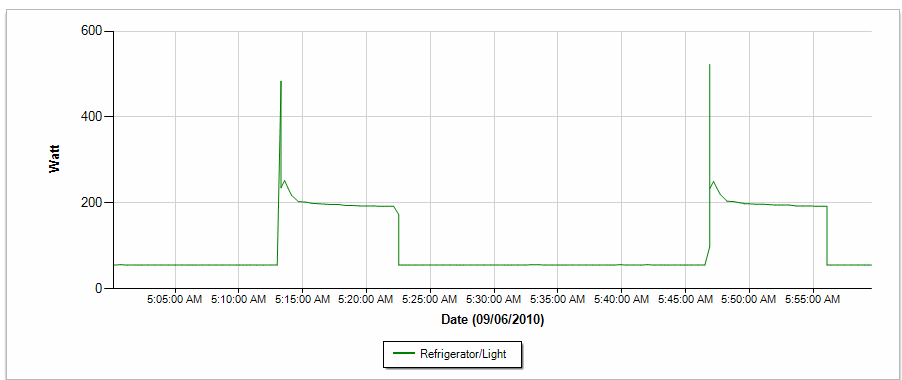
Refrigerator:
As you can see, the refrigerator causes a sharp spike when the compressor starts. The compressor runs until the temperature has dropped to the desired, then the compressor stops. You can clearly identify this cycle by looking at the chart. This cycle can tell you a lot about the refrigerators efficiency and condition.
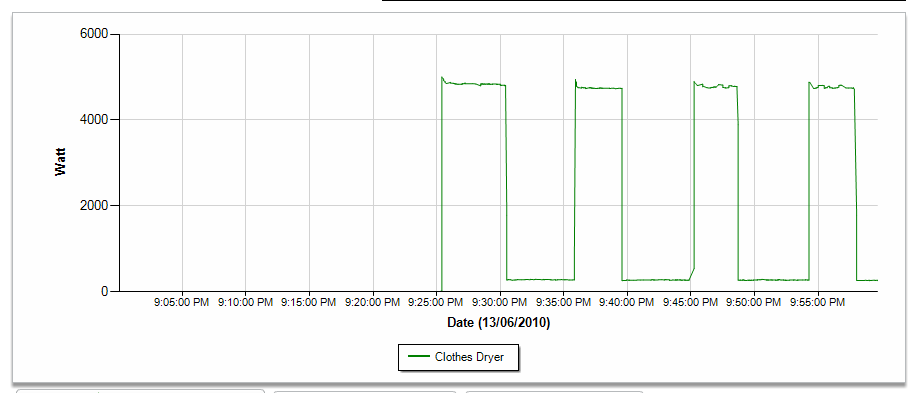
Clothes Dryer:
The dryer profile is also quite simple. You can clearly identify when the motor and heater is running and when the motor is running with the heater off.
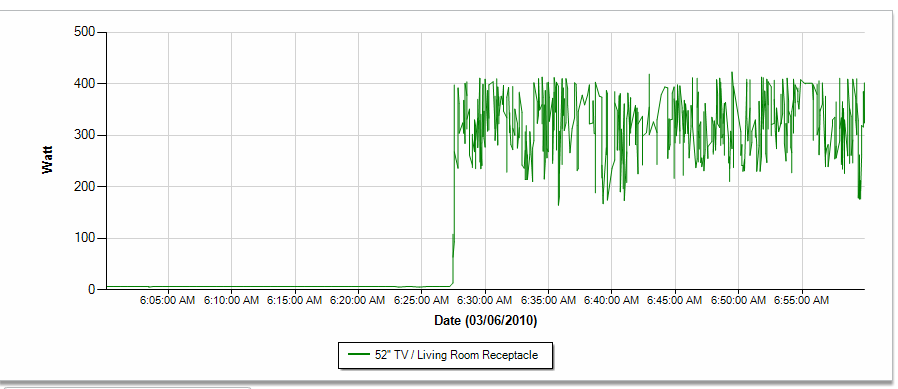
52" LCD TV:
The load profile for this large screen TV is quite interesting. It is amazing to see how much variation in power is caused by light/dark scenes.... perhaps there is a saving to be had by reducing the brightness at night?
-
Attachments
-
- Load profile TV.png (29.89 KiB) Viewed 18970 times
-
- Load profile fridge.png (9.75 KiB) Viewed 18970 times
-
- Load profile dryer.png (11.72 KiB) Viewed 18970 times
-
jmlarson
- Posts: 8
- Joined: Wed Jun 03, 2020 2:27 pm
Post
by jmlarson » Mon May 31, 2021 9:45 pm
AND JUST FOR FUN...
The plot line itself tells you instentaneous demand. For those of us with a demand charge, this is useful information. The area under the curve is your power use, or consumption - measure in kwh, typically - which is how most customers in the US are billed.
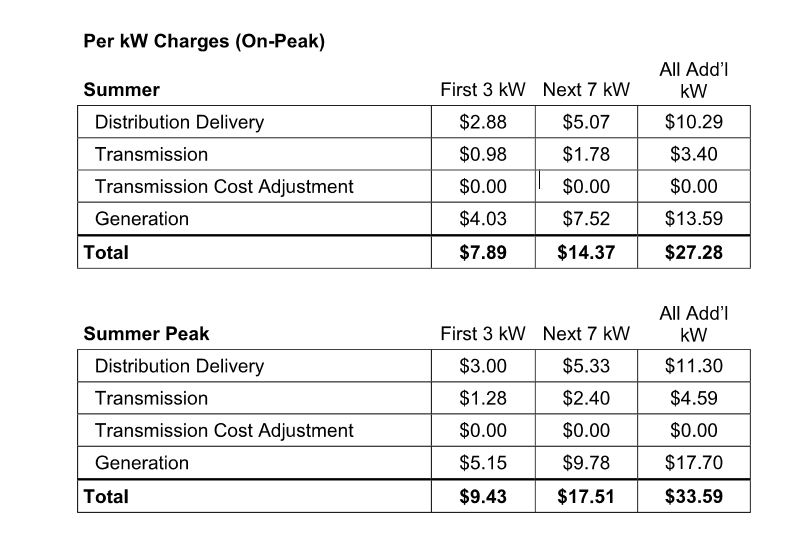
Our utility in AZ on the particular plan which we are on bills us a demand charge based on a 30min increment - so the average demand over a 30 min time period during the summer hours of 1-8PM. Fun fact = to calculate the demand charge, if you know the kwh for the 30 time period, double it and drop the 'h' and you get your kw - your average demand. For a 15 min average demand (such and the commercial account I manage), you would take the kwh over the 15 min period and quadrouple it....drop the 'h' and you have your demand in kw.
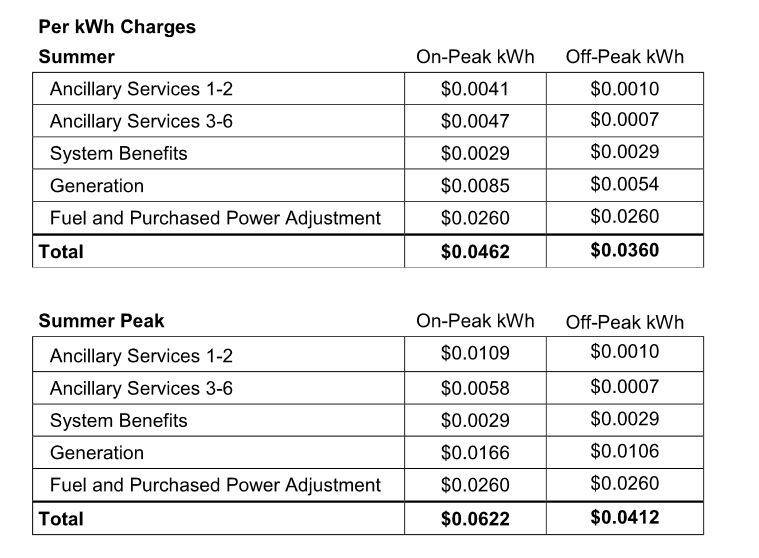
pic of our summer demand and consumption rates attached
Based on the below, you can see how your bill climbs exponentially if you mess up your demand, but also how you can live fairly inexpensively if you manage your demand.
-
Attachments
-
- consumption.JPG (81.98 KiB) Viewed 10801 times
-
- demand.JPG (77.78 KiB) Viewed 10801 times