Page 1 of 4
Grafana Dashboard now working... very quick
Posted: Sun Sep 11, 2016 8:10 am
by roscoe
finally decommissioned EngineG and its Dashboard, it was great for free, but sluggish very slow UI and tied up an old laptop, so .... now have..
serial/eth >> btmon.py > influxdb > grafana
All software runs on a smallish Virtual Machine (ubuntu) and boy its snappy, very very quick.
Will try to post a couple of pics if the forum lets me.
Re: Grafana Dashboard now working... very quick
Posted: Sun Sep 11, 2016 8:11 am
by roscoe
screenshot 1, with live values in SINGLESTATS
Re: Grafana Dashboard now working... very quick
Posted: Sun Sep 11, 2016 8:13 am
by roscoe
extra screenshots, so lil-old ECM logs GAS on Aux5, and has Solar PV generation, and also a channel for an electric car...
did I say the dashboard was quick !
Re: Grafana Dashboard now working... very quick
Posted: Mon Sep 19, 2016 6:37 am
by roscoe
not posting anymore pics, but now sorted the spikey or jaggyness on power displays
seems that my ECM1240 setup (aka me 5 years ago) was being too clever and using PACKET TRIGGER = 80w
which caused lovely high resolution packets on power changes
BUT was causing false spikes when the DERIVATIVE was calculating power
now happy with 10s packet sends but no power triggers, all fine
No need for MOVING AVERAGE sillyness down the line !
Re: Grafana Dashboard now working... very quick
Posted: Mon Sep 19, 2016 9:51 am
by ben
roscoe wrote:not posting anymore pics, but now sorted the spikey or jaggyness on power displays
seems that my ECM1240 setup (aka me 5 years ago) was being too clever and using PACKET TRIGGER = 80w
which caused lovely high resolution packets on power changes
BUT was causing false spikes when the DERIVATIVE was calculating power
now happy with 10s packet sends but no power triggers, all fine
No need for MOVING AVERAGE sillyness down the line !
We default the trigger to 8000 now due to the issues you're experiencing.
Re: Grafana Dashboard now working... very quick
Posted: Wed Sep 27, 2017 12:14 am
by networkingdude
Got a tutorial for this? So beautiful!
Re: Grafana Dashboard now working... very quick
Posted: Thu Oct 05, 2017 7:40 am
by roscoe
sorry no tutorial, but it looks even better nowadays..
here is the solar page
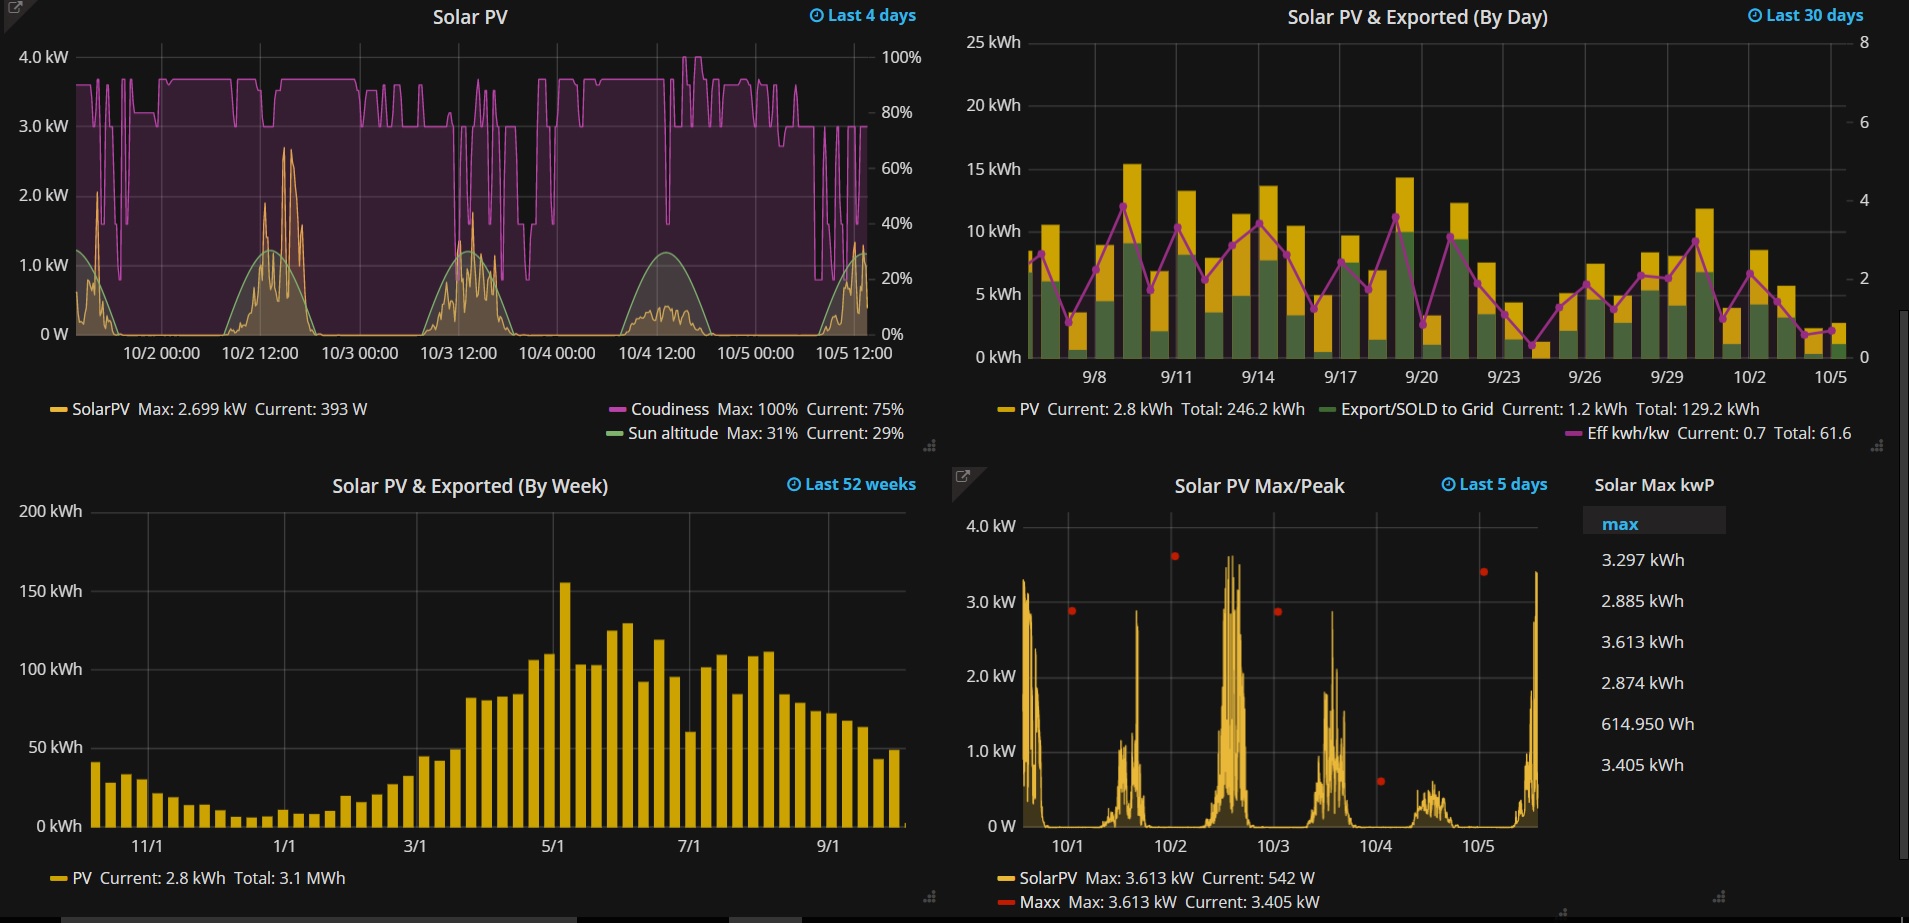
- SolarPV.jpg (307.16 KiB) Viewed 19154 times
networkingdude wrote:Got a tutorial for this? So beautiful!
Re: Grafana Dashboard now working... very quick
Posted: Thu Oct 05, 2017 7:44 am
by roscoe
& more, gas stuff, with alerts on freezing etc
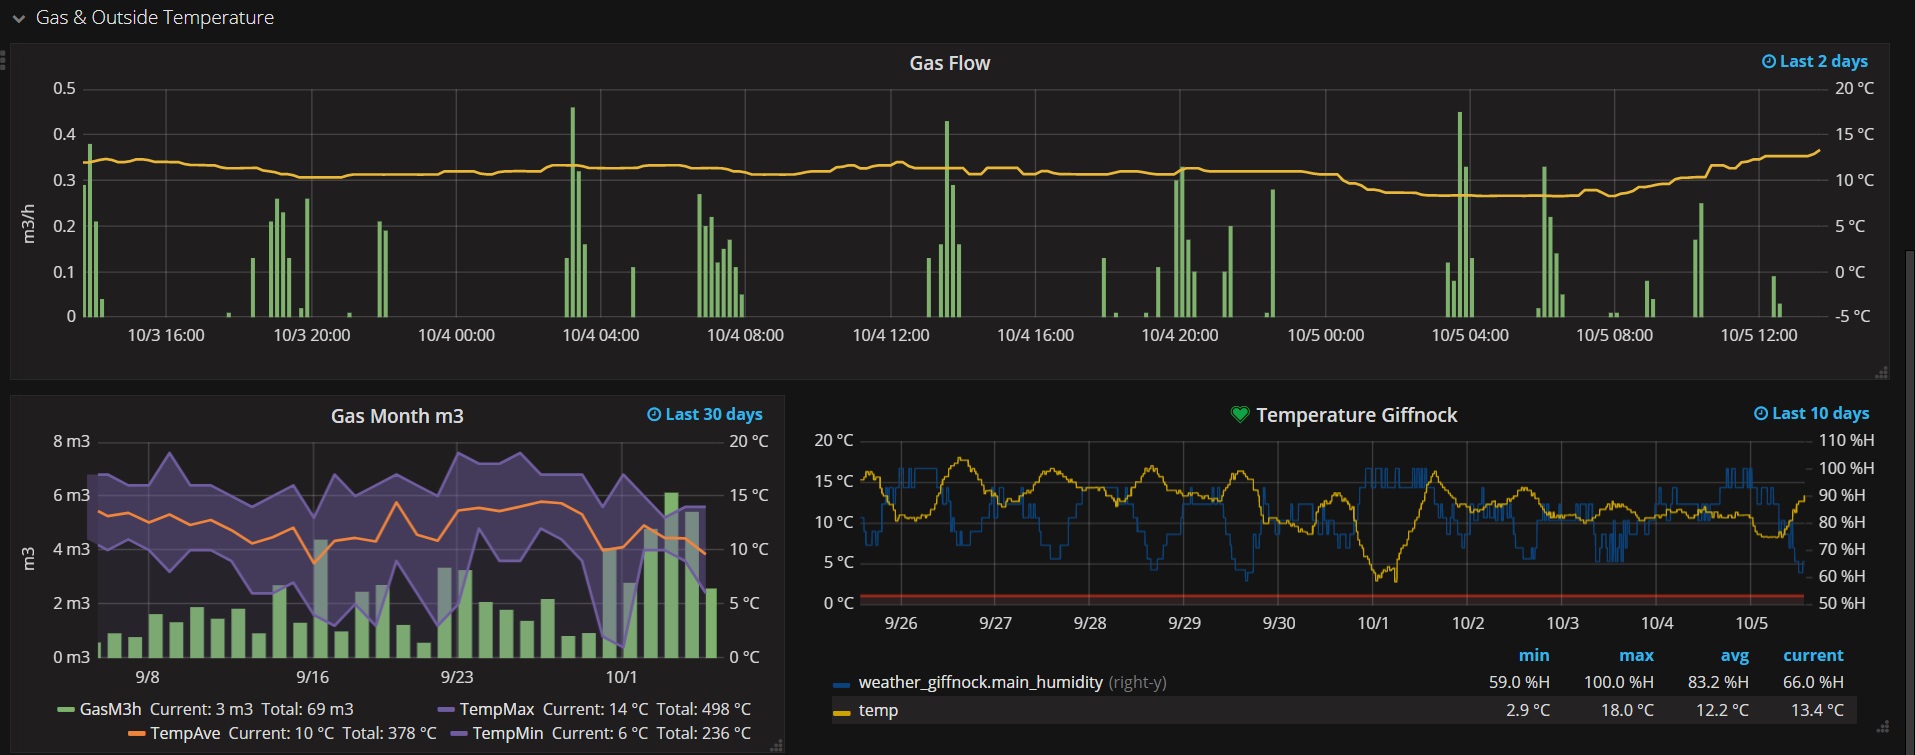
- gas.jpg (259.14 KiB) Viewed 19152 times
Re: Grafana Dashboard now working... very quick
Posted: Fri Oct 06, 2017 3:37 pm
by ben
networkingdude wrote:Got a tutorial for this? So beautiful!
I did some experimentation with Grafana/Influx/BTMon that you can use as a starting point.
I've uploaded it here:
http://www.brultech.com/files/BTMonGrafanaInflux.zip
You'll need to install Python 2.7
Start by editing btmon.cfg
- Replacing the GEMIP field with the IP of your GEM. (Or change the settings completely for an ECM-1240.)
- Edit the influxdb_database = testing line, change testing to something else.
Run startinflux.exe and startgrafana.exe then run btmon.py
Re: Grafana Dashboard now working... very quick
Posted: Mon Nov 27, 2017 9:27 am
by networkingdude
Thanks for providing that package Ben, on a fresh Windows 10 install in addition to python you must do "pip install influxdb" otherwise it won't run. I also had to change the port to 80 for the GEM as the default didn't work. I also didn't see any dashboard included but it was fairly easy to make one.